matplotlib - Tweet Data Analysis
Tweets Analysis - Keyword: @matplotlib
Overview
Tweets covering
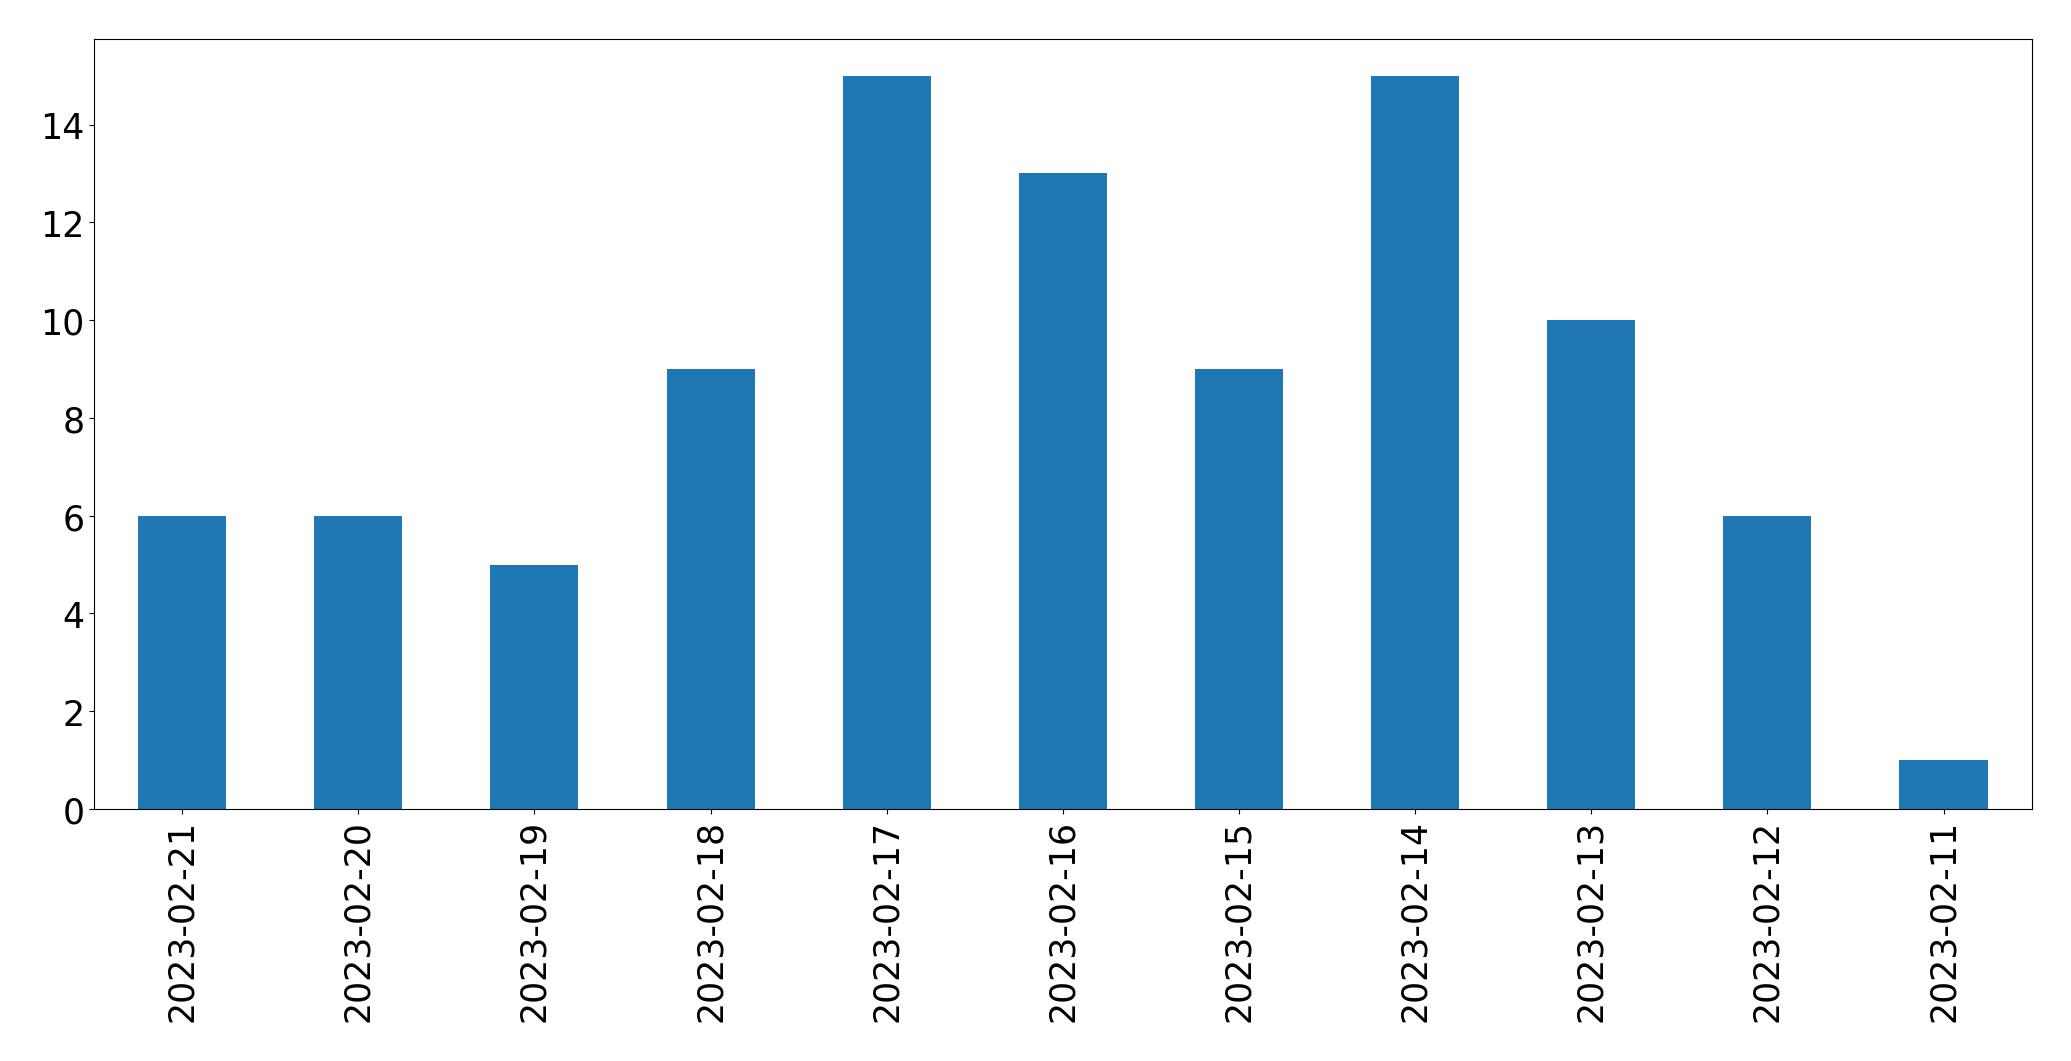
10 days
Latest tweet was on
2023-02-21
Earliest tweet was on
2023-02-11
Total number of tweets analysed
95
Average age of authors' accounts
8 years
Summarization
It is possible to add watermarks to @matplotlib plots and its default blue and orange colors are very popular in data visualizations. Bootstrap is an intuitive and versatile statistics development and Python with SciPy_team, matplotlib, and NumPy team can help learn how to use it. In the past week, @matplotlib has been used to animate earthquakes in Turkey and Syria, detect the re-entry of a meter-sized asteroid into the atmosphere, and show principal component analysis for inference Machine Learning. Various seismic events have been recorded in different countries and its features such as the travel time and depth have been shown with python and matplotlib. A new matplotlib has also been dropped and congrats to the team.
Topic Modeling
- Data Science
- Earthquake Science
- Machine Learning
- Animation, Visualization, and Plotting
- Asteroid and Meteor Science
Emotional Analysis
Trend Analysis
- Data visualization using matplotlib
- Earthquakes and related seismologic research
- Citizen Science involvement
- Machine Learning and its analysis
- Meteor observations and radar
Disclaimer: The text analysis on twtdata.com, powered by OpenAI, does not represent the views of twtdata.com or its affiliates. The analysis is for informational purposes only and not an endorsement of any viewpoint.
Types of Tweets
Number of Retweets
40
42% of total
Number of Original tweets
20
21% of total
Number of tweets that were Quotes
7
7% of total
Number of tweets that were Replies
33
34% of total
Number of tweets that contain Hashtags
41
43% of total
Number of tweets that contain Mentions
95
100% of total
Devices Used to Tweet
Top 5 Devices
| Source | Count |
|---|---|
| Twitter Web App | 37 |
| Twitter for Android | 16 |
| Twitter for iPhone | 15 |
| TweetDeck | 11 |
| Twitter for iPad | 4 |
Device Distribution

Top 10 Accounts by Followers
| Username | Name | Bio | Followers count |
|---|---|---|---|
| EdwardTufte | Edward Tufte | Statistician,visualizer,artist, professor. Founded Graphics Press, Hogpen Hill Farms, ET Modern Gallery | 111,367 |
| StormHour | #StormHour | Promoting Meteorology & Weather Photography since 2015Get your work seen and shared with a member's spotlight ✨ at ~ https://t.co/rjEw4xr5Yv | 97,516 |
| driscollis | Mike Driscoll | I tweet about everything #PythonWriting about Python @mousevspython @realpythonTeaching at @TeachMePyAuthor of multiple books including Python 101 | 96,718 |
| matplotlib | Matplotlib | Python library for creating static, animated, & interactive visualizations. Chat w/ us @ https://t.co/QDNR5Khj9w Sponsored by @NumFocus | 42,257 |
| esMktDigital | 🅴🆂 🅼🅰🆁🅺🅴🆃🅸🅽🅶 🅳🅸🅶🅸🆃🅰🅻 | 👨🔬 #DataScience👨💻 #FullStackDevelopment🎯 #Marketing📢 #SocialSelling👥 #Networking🛒 #eCommerce🔎 #Seo | 14,375 |
| raspishake | Raspberry Shake | Join the largest #CitizenScience #earthquake monitoring network w/ your own #seismograph. For exclusive #quake notifications: @raspishakEQ. MobileApp: #ShakeNet | 10,254 |
| sonofacorner | Son of a corner | Trying to help people learn more about @matplotlib with football (soccer) data.Donations: https://t.co/dSttGWtRJV | 7,843 |
| GeostatsGuy | Michael Pyrcz🌻 | Assoc. #Prof @UTAustin @CockrellSchool @txgeosciences @daytum_io | #Ukrainian Canadian #geostatistics #DataAnalytics #DataScience #MachineLearning #author #dad | 7,485 |
| s_gruppetta_ct | Stephen Gruppetta | • Rethinking how to teach coding to children & adults • https://t.co/ThObHuu1rG • @codetoday_ & @ThePythonPlace • RealPython author • Ex-Physicist • | 6,892 |
| MurrayData | John Murray | Data Scientist & Visiting Professor @geodatascience. Talks about #opendata #AI #deeplearning #geospatial #GPU #HPC #kubernetes #datascience @ApacheArrow #Python | 6,495 |
Top 10 Accounts by Friends
| Username | Name | Bio | Followers count |
|---|---|---|---|
| StormHour | #StormHour | Promoting Meteorology & Weather Photography since 2015Get your work seen and shared with a member's spotlight ✨ at ~ https://t.co/rjEw4xr5Yv | 56,326 |
| esMktDigital | 🅴🆂 🅼🅰🆁🅺🅴🆃🅸🅽🅶 🅳🅸🅶🅸🆃🅰🅻 | 👨🔬 #DataScience👨💻 #FullStackDevelopment🎯 #Marketing📢 #SocialSelling👥 #Networking🛒 #eCommerce🔎 #Seo | 7,583 |
| MurrayData | John Murray | Data Scientist & Visiting Professor @geodatascience. Talks about #opendata #AI #deeplearning #geospatial #GPU #HPC #kubernetes #datascience @ApacheArrow #Python | 7,135 |
| fullNam35087976 | akasatanahama.com | I enjoy programming as a hobby😀This account is a Bot that just do retweets, followback, and like😀It's not a company😀It does't respond to DM or replies😀 | 6,028 |
| jmtoralc | Manuel Toral | Hago análisis con datos 💻 Traigo seis millones de maneras de morir, sólo una de vivir...🔥 | 5,816 |
| oyuncakdunya_ | ϜϓſϞ irem Ⓥ 🙂 🐭 #animalslivesmatter | yer bilimleri, doğa, motor sporları ve hayvan aşığı @raspishake #vatandaşbilimi programı üyesi #catmom her rt ve fav onay değildir | 5,000 |
| skagao | ヨンプラザさとるGちゃん | y_new_pred = StandardScaler_y.inverse_transform( MLmodel_instance.predict( StandardScaler_X.transform( X_new[ X_train.columns ]) ).reshape(-1,1) ) | 4,997 |
| adolflow | c-x n s c-x n w 🌾 | cultura libre, web semántica, sindominio, datalab, periodismo de datos, sanidad y educación pública, para empezar | 4,374 |
| raspishake | Raspberry Shake | Join the largest #CitizenScience #earthquake monitoring network w/ your own #seismograph. For exclusive #quake notifications: @raspishakEQ. MobileApp: #ShakeNet | 3,863 |
| justAfanDavid | david doll | If I have seen further it is by standing on the shoulders of giants-Newton. Engineer, writer, analyst, program/project mgr and naturally curious. | 3,847 |
Most Active Users
| Username | Bio | Number of tweets |
|---|---|---|
| gmrpetricca | MSc Space Science and Technology | MRes Renewable Energy Engineer | WX | History | Seismo | Astro | Photo | PC/Gaming | SciFi | SDR | https://t.co/XS3yCkBGw0 | 9 |
| driscollis | I tweet about everything #PythonWriting about Python @mousevspython @realpythonTeaching at @TeachMePyAuthor of multiple books including Python 101 | 4 |
| GeostatsGuy | Assoc. #Prof @UTAustin @CockrellSchool @txgeosciences @daytum_io | #Ukrainian Canadian #geostatistics #DataAnalytics #DataScience #MachineLearning #author #dad | 4 |
| mohdatif1987 | Database techie. Now learning Python and other libraries such as Pandas, Matplotlib. | 3 |
| s_gruppetta_ct | • Rethinking how to teach coding to children & adults • https://t.co/ThObHuu1rG • @codetoday_ & @ThePythonPlace • RealPython author • Ex-Physicist • | 2 |
| bendominguez011 | @fantasydatapros founder. I teach people how to code with sports. Building sports betting models in Python and showcasing progress and reasoning. | 2 |
| justAfanDavid | If I have seen further it is by standing on the shoulders of giants-Newton. Engineer, writer, analyst, program/project mgr and naturally curious. | 2 |
| mgrubisic | Structural Engineer/Asst. Prof., Earthquake Engineering & Structural Dynamics, University of Osijek | Father of two 💭 🍺 🌍 🌊 | 2 |
| PamphileRoy | Senior Software Engineer at @quansightai / SciPy core-developer / Aerospace Ph.D, Engineer | 2 |
| sinabooeshaghi | I'm a postdoc in @lpachter's lab with a PhD from @caltech and a Math & ME BS from @mit. I enjoy drinking tea, riding bikes, taking photos, and exploring nature. | 1 |
Tweets Per Day
Top 10 Tweets by Retweets
| ID | Text | Retweet count |
|---|---|---|
| 1626252292218298368 | Did you know you can add watermarks to your @matplotlib plots?Here's an example and the result too!🐍📊🔥 https://t.co/atDrb2yZWk | 30 |
| 1625253864315187228 | Animation of ~1800 events recorded in the last 7 days by the @raspishake network after major M7.8 & M7.5 #Turkey #Syria #earthquake. The distribution of the shocks in the area … | 26 |
| 1625201154257825799 | Last night a metre-sized #asteroid (#2023CX1 #Sar2667) re-entered our atmosphere around 03UTC over #TheChannel #LaManche. Some @raspishake #RBOOM #infrasound sensors (in #France, #Belgium, & The #Netherlands) managed to record the … | 17 |
| 1625140724525146114 | Bootstrap! Super intuitive, versatile & one of the most powerful #stats developments of the 20th century. Join me for a live code walk-through & learn how to #bootstrap in #Python … | 11 |
| 1624806113056067588 | 2023-02-12 M3.2 #NorthSea #earthquake recorded from the closest #RaspberryShake in #SouthNorfolk #UK + area historical seismicity. Clear P and S waves' arrivals on all channels. Dist.: 120.8km Travel Time: 0m … | 9 |
| 1626551786130624513 | I just published "Visualizing Climate Change: A Step-by-Step Guide to Reproduce Climate Stripes with Python"https://t.co/MgJKtimsK4@matplotlib @TDataScience | 6 |
| 1625102346345668609 | 2023-02-13 M6.1 #Kermadec Islands #earthquake recorded in #Scotland & in #Stornoway + area historical seismicity. Clear core wave spike on many stations. Dist.: 16821.8km Travel Time: 17m 3.7s Depth: 374km … | 5 |
| 1627737571018084360 | 2023-02-20 M6.3 3 km SW of Uzunbağ, #Turkey #earthquake recorded in #Scotland & in #Stornoway + historical seismicity.Largest event in the area since ~two weeks ago.Dist.: 3851.4kmTravel Time: 6m 55.6sDepth: … | 5 |
| 1625506956965191681 | 2023-02-14 M5.6 2 km NW of #Leleşti, #Romania #earthquake recorded in #Scotland & in #Stornoway + area historical seismicity. Clear P-wave arrival on all stations in the region. Dist.: 2390.1km … | 5 |
| 1628071098364440590 | Interested in inferential #MachineLearning? Principal component analysis (PCA), a powerful method for your workflow. Linear projection to reduce dimensionality while maximizing the variance retained!Here's my #Python @matplotlib demo @ https://t.co/ICuLnhmJot … | 3 |
Top 10 Tweets by Likes
| ID | Text | Like count |
|---|---|---|
| 1626252292218298368 | Did you know you can add watermarks to your @matplotlib plots?Here's an example and the result too!🐍📊🔥 https://t.co/atDrb2yZWk | 190 |
| 1625318588981870594 | committed to the bit. @matplotlib default blue and default orange nails https://t.co/x0Z1WqydDy | 87 |
| 1625140724525146114 | Bootstrap! Super intuitive, versatile & one of the most powerful #stats developments of the 20th century. Join me for a live code walk-through & learn how to #bootstrap in #Python … | 57 |
| 1625253864315187228 | Animation of ~1800 events recorded in the last 7 days by the @raspishake network after major M7.8 & M7.5 #Turkey #Syria #earthquake. The distribution of the shocks in the area … | 52 |
| 1625201154257825799 | Last night a metre-sized #asteroid (#2023CX1 #Sar2667) re-entered our atmosphere around 03UTC over #TheChannel #LaManche. Some @raspishake #RBOOM #infrasound sensors (in #France, #Belgium, & The #Netherlands) managed to record the … | 38 |
| 1628071098364440590 | Interested in inferential #MachineLearning? Principal component analysis (PCA), a powerful method for your workflow. Linear projection to reduce dimensionality while maximizing the variance retained!Here's my #Python @matplotlib demo @ https://t.co/ICuLnhmJot … | 19 |
| 1626551786130624513 | I just published "Visualizing Climate Change: A Step-by-Step Guide to Reproduce Climate Stripes with Python"https://t.co/MgJKtimsK4@matplotlib @TDataScience | 19 |
| 1625506956965191681 | 2023-02-14 M5.6 2 km NW of #Leleşti, #Romania #earthquake recorded in #Scotland & in #Stornoway + area historical seismicity. Clear P-wave arrival on all stations in the region. Dist.: 2390.1km … | 16 |
| 1625558281681833994 | As many people are sharing the "Google (sqrt(cos(x))*cos(400*x)+sqrt(abs(x))-0.4)*(4-x*x)^0.1" tweet, I thought it appropriate to test it using @numpy_team, @numba_jit and @matplotlib #Python. #HappyValentinesDay! https://t.co/eVTldIDEko | 16 |
| 1624806113056067588 | 2023-02-12 M3.2 #NorthSea #earthquake recorded from the closest #RaspberryShake in #SouthNorfolk #UK + area historical seismicity. Clear P and S waves' arrivals on all channels. Dist.: 120.8km Travel Time: 0m … | 15 |
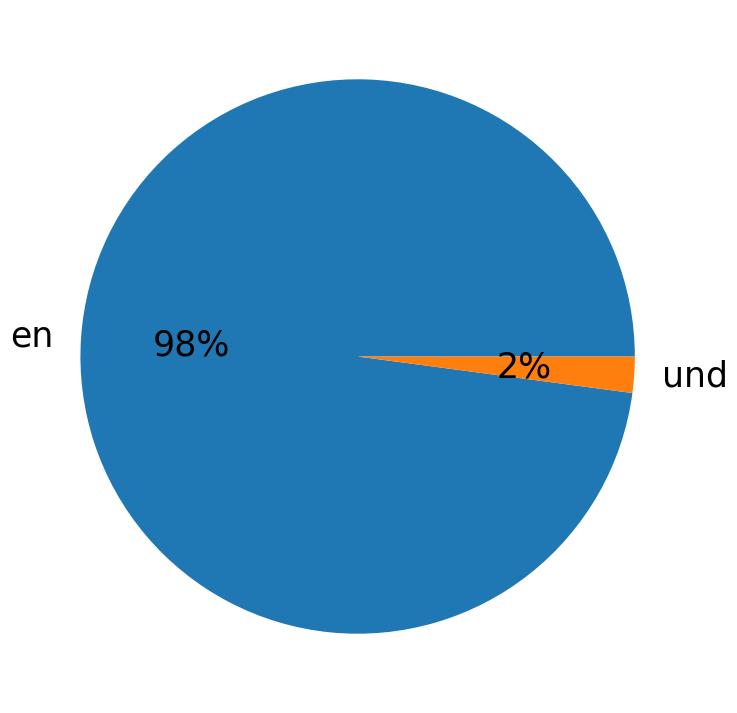
Top Languages Used
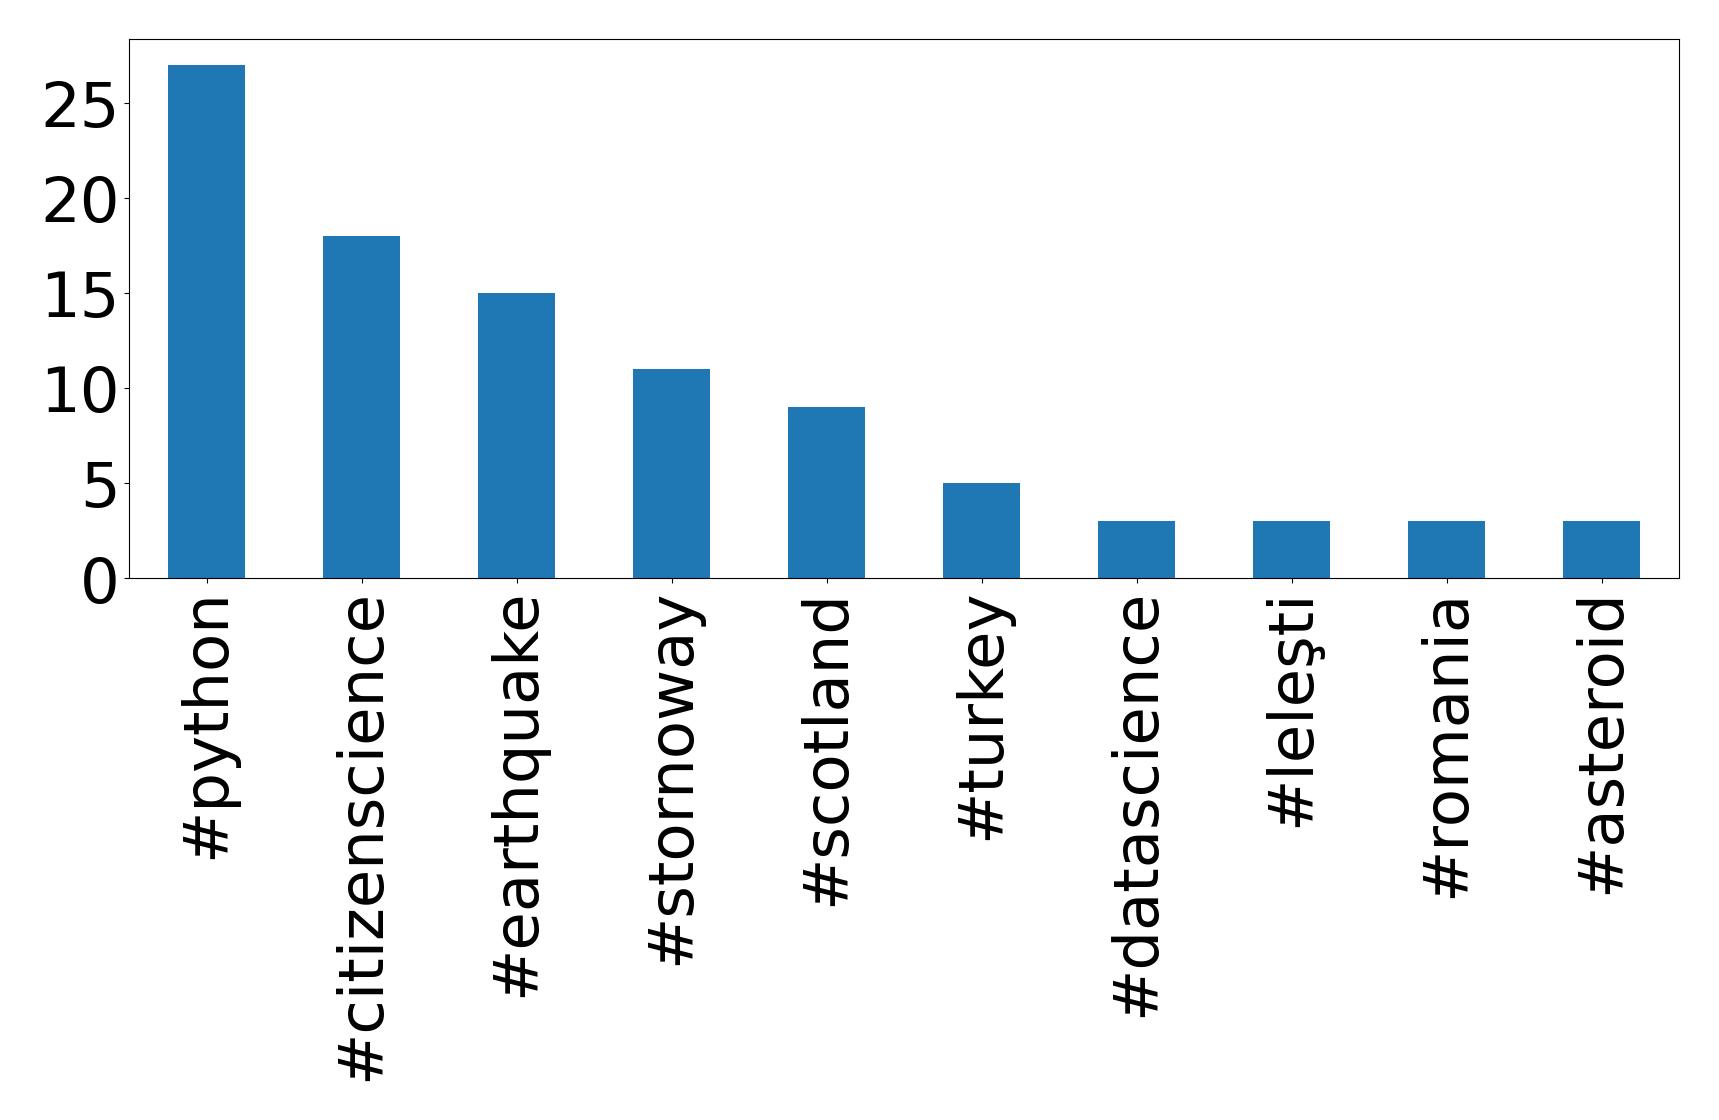
Top 10 Hashtags
| Hashtag | Count |
|---|---|
| #python | 27 |
| #citizenscience | 18 |
| #earthquake | 15 |
| #stornoway | 11 |
| #scotland | 9 |
| #turkey | 5 |
| #datascience | 3 |
| #leleşti | 3 |
| #romania | 3 |
| #asteroid | 3 |
Top 10 Mentions
| Mention | Count |
|---|---|
| @matplotlib | 91 |
| @raspishake | 21 |
| @gmrpetricca | 14 |
| @numpy_team | 11 |
| @geostatsguy | 7 |
| @scipy_team | 7 |
| @airspy_com | 6 |
| @driscollis | 6 |
| @tdatascience | 5 |
| @guillaumewein | 4 |

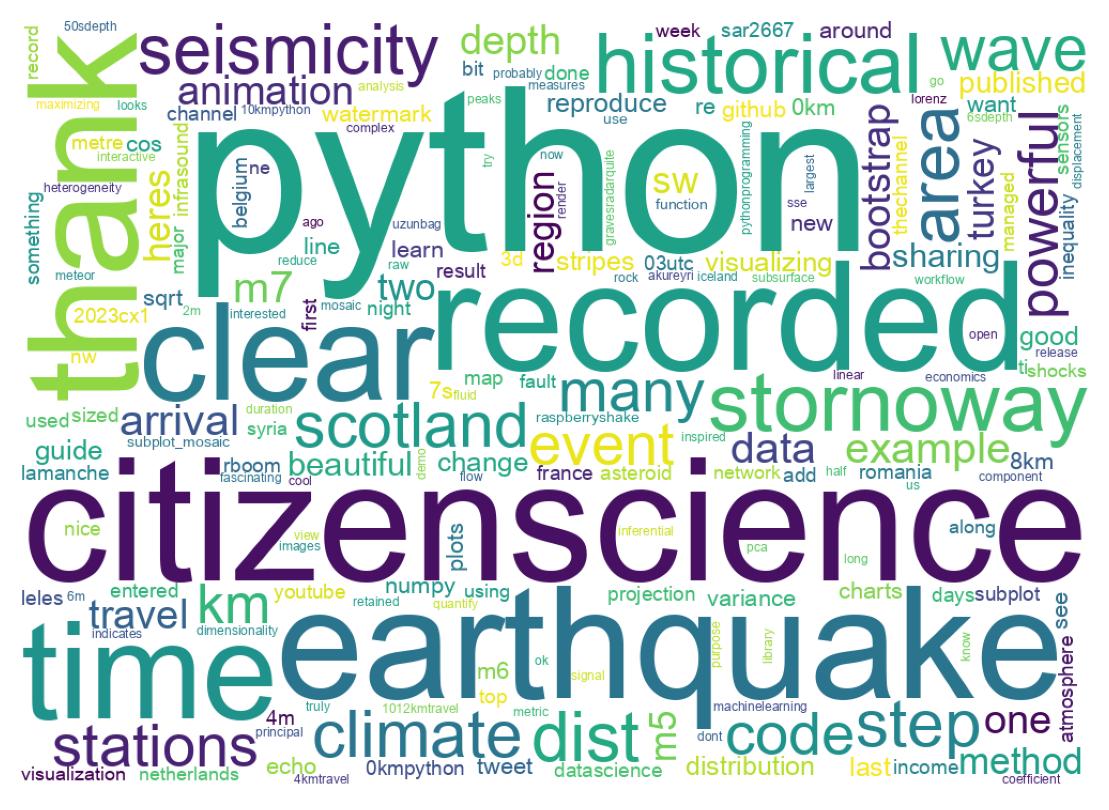
Wordcloud of Tweets
Emoji Analysis
Average emojis per tweet:
23
Emojis Used
| Emoji | Count | Emoji Text |
|---|---|---|
| 🐍 | 4 | snake |
| 📊 | 2 | bar_chart |
| 🔥 | 2 | fire |
| 🥳 | 2 | partying_face |
| 👏 | 2 | clapping_hands |
| 📈 | 1 | chart_increasing |
| ✨ | 1 | sparkles |
| 🙏 | 1 | folded_hands |
| 💻 | 1 | laptop |
| 👇 | 1 | backhand_index_pointing_down |
Emoji Groups
| Emoji Group | Count |
|---|---|
| People & Body | 5 |
| Animals & Nature | 4 |
| Objects | 4 |
| Smileys & Emotion | 4 |
| Activities | 3 |
| Travel & Places | 2 |
Need Custom Twitter Data Analysis?
Get detailed insights on any keyword, hashtag, or account with twtData.
Get Started